Practical Accounting Training
Register NowCourse Overview
What You'll Gain
Student Success Stories
"This course completely transformed my approach to professional development. The practical tools are incredibly valuable."
Previous StudentWhat Our Clients Say About Us
Hear from professionals who have experienced our training programs
"Wow. I am so grateful to be certificated by this prestigious institution. It was indeed very interesting getting the views of other professional colleagues on the platform during our sessions. Hope to be a part of another program very soon"
Israel Borweh
Liberia
"I completed the Practical Accounting Course with Advantage of Africa School of Leadership, and it was a very impactful and flexible learning experience, especially with the evening sessions. I gained deeper practical knowledge in preparing asset registers an area I previously only understood at a basic level and now feel highly confident in it. Overall, the course was extremely beneficial and relevant to real-world practice."
Rwema Derrick
Rwanda
"I came to know Vantage Africa School of Leadership through a friend who was doing Monitoring and Evaluation. I ended up doing 3 courses (M&E, Resource Mobilization and Practical Accounting). What I loved and will always love is the methodology used… I was able to learn so much within a short period of time."
Mr. Amsii Andilkou Maximilien
Ghana
Our Background and Expertise
Our Philosophy
Case Study
Real-world impact of our training programs
How We Conduct Our Trainings
Our Unique Approach
Our programs combine live interactive sessions with structured e-learning that unlocks only after completion ensuring mastery, not passive attendance. Every session is built around real-work deliverables, toolkits, and case-based problem solving rooted in African business realities. We enforce accountability through mandatory participation and competence-based progression. The outcome is not just knowledge but immediate workplace readiness.
Real Case Studies
Each module features real-world examples from African SMEs, NGOs, and corporates showing how accounting decisions affect organizational sustainability.
Individual Projects
Participants complete a project where they develop a mini financial report or accounting system for a real or simulated organization.
Simulations and Software Practice
Step-by-step guidance through QuickBooks setup, journal entries, reconciliation, and tax filing.
Peer Problem-Solving Pods
Weekly sessions where participants review each other’s accounting challenges and present solutions collaboratively.
E-Learning Platform
Recorded tutorials, PowerPoint notes, templates, and self-assessment quizzes after every topic ensure retention and mastery.
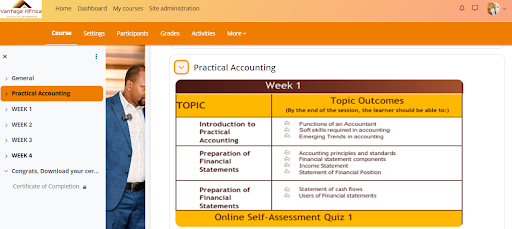
Our E-Learning Platform
Access comprehensive training materials anytime, anywhere
Get Certified
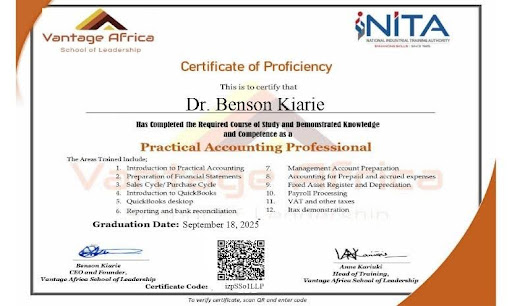
Upon successful completion of our training programs, you will receive a professional certificate recognizing your achievement and new skills.
Our certificates are:
- Internationally recognized
- Digitally verifiable
- Industry-standard certified
- Proof of your expertise
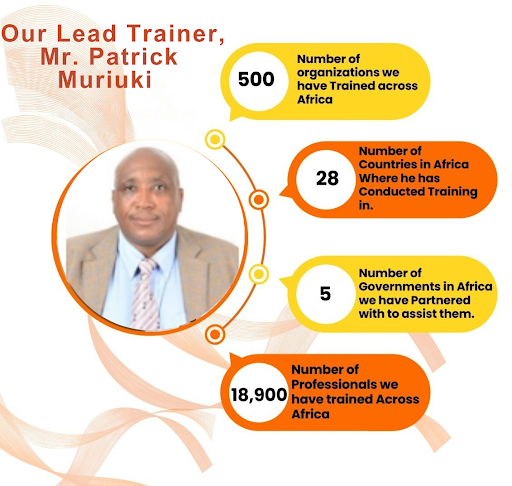
Meet Your Lead Trainer